Page speed is important to measure because it can affect how users experience and engage with a website. A slow-loading page can lead to higher bounce rates, lower conversions, and reduced customer satisfaction, while a fast-loading page can improve the user experience and increase engagement.
Page speed also affects SEO, as it is a confirmed Google ranking factor. A site that loads quickly and offers a great user experience (UX) is more likely to be popular with visitors and thus more visible in Google search results.
Save time by using our Page Speed checker to measure Page speed and Core Web Vitals for a large number of URLs in bulk.
How to check your website speed in bulk
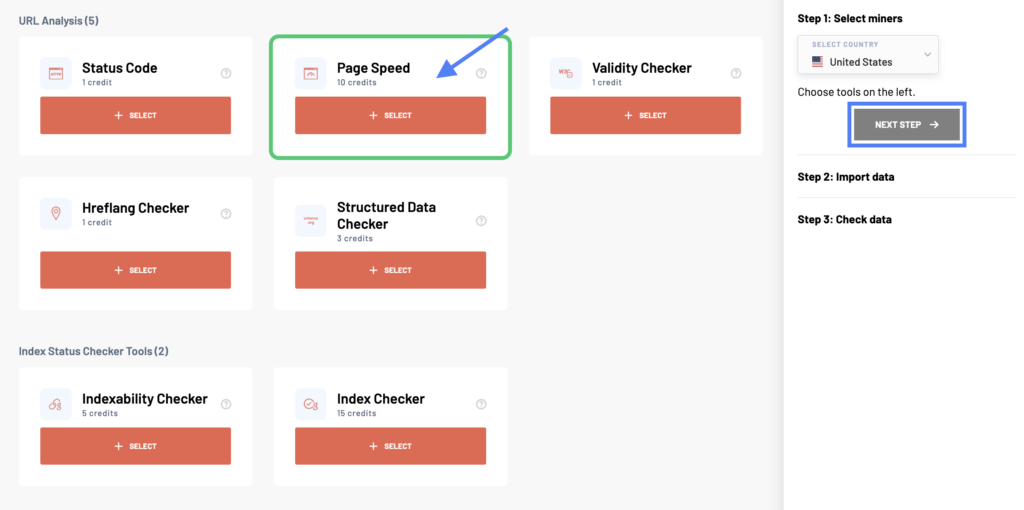
Start by clicking the Create report button and selecting the country you want data for. Then, select Page Speed miner. In settings, you can also choose whether to check page speed for mobile or desktop.
- Desktop: Using the desktop version of its crawler, Marketing Miner will pull data from Google’s Pagespeed Insights tool. All data in the report will refer to desktop output, and moreover, it won’t test if the page is mobile-friendly.
- Mobile: Unlike the above test, Google’s Pagespeed Insights uses the mobile version of the crawler. Marketing Miner will also test if the analyzed pages are optimized for mobile devices.

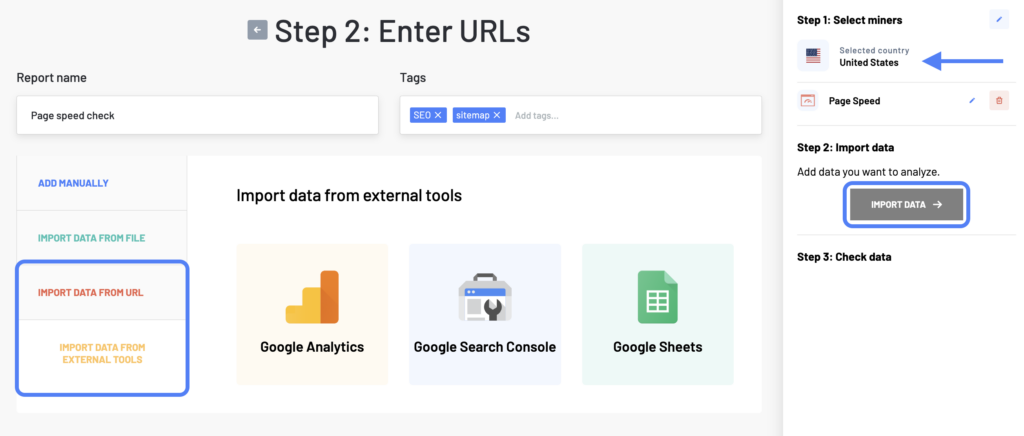
After selecting the tool, click on Next Step to continue. Name your report and add a list of URLs you want to check. You can either enter the list manually, upload a file or sitemap, or import your data from Google Analytics, Google Search Console, or Google Sheets.
If you want to quickly test all the URLs from your sitemap, we recommend that you click the Import Data from URL tab to add your sitemap URL. This will automatically load all URLs from the file. Alternatively, you can connect to your Google Analytics/Search Console account to test only specific landing pages.

Once the report is generated, you will be emailed the analyzed data.
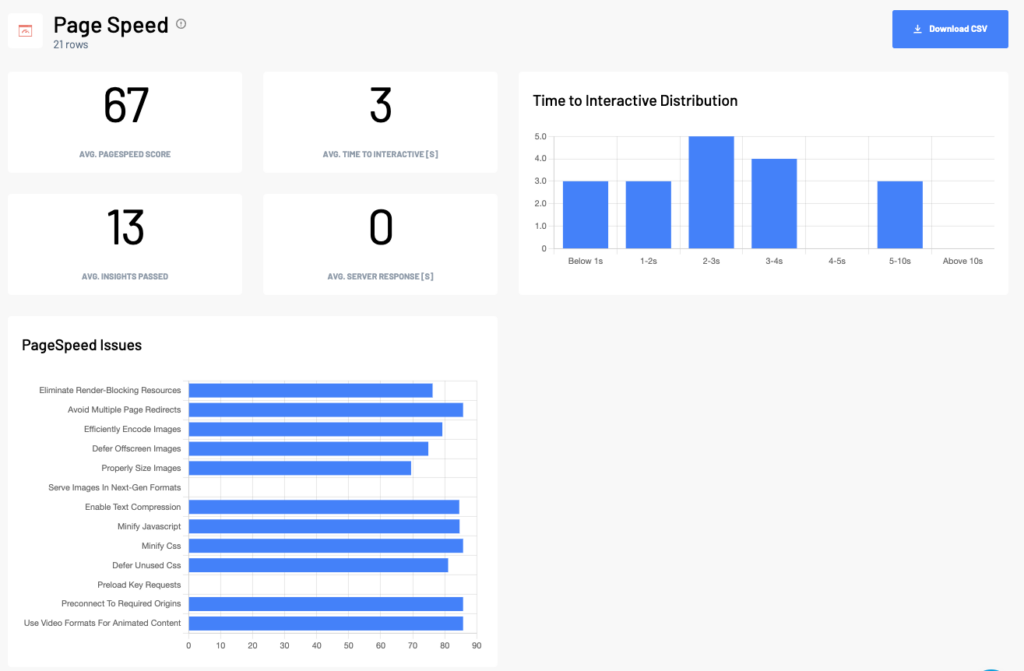
Page Speed report example
To quickly see your average PageSpeed score or any problems the tool detected, you can navigate to the Visualizations tab after opening your report.

In the Data overview tab, you will then be able to see detailed page speed statistics, Core Web Vital metrics, and any errors that were found.
Report columns
Page Speed report
- Input: Analyzed URL.
- PageSpeed Score: PageSpeed Score according to PageSpeed Insights.
- Insights passed: Number of fulfilled recommendations according to Google Pagespeed Insights.
- Mobile friendly: Determines (only when crawling the mobile version) whether the page is optimized for mobile devices.
- Speed Index: Speed index score analyzes how fast the URL content loads. The lower the score, the better/faster (detailed metric description).
- Time to Interactive / s: Metric that measures the amount of time it takes until the URL is interactive (detailed description of the metric).
- Server Response / s: Response time of the server.
- First Meaningful Paint / s: Metric measuring the time until the user notices that the page’s primary content has loaded (detailed metric description).
- First Contentful Paint / s: FCP measures how long it takes the browser to render the first piece of DOM content after a user navigates to your page (detailed metric description).
- First input delay (CrUX) / s: FIP taken from Chrome User Experience database. Summary about what FIP the users of the respective URL have on average.
- First contentful paint (CrUX) / s: FCP is a metric from the Chrome User Experience database. Summary of which FCP users of this URL have on average.
Page Speed issues
[Server response times are low (TTFB)](https://developers.google.com/web/tools/lighthouse/audits/ttfb)
[Eliminate Render-Blocking Resources](https://developers.google.com/web/tools/lighthouse/audits/blocking-resources)
[Avoid Multiple Page Redirects](https://developers.google.com/web/tools/lighthouse/audits/redirects)
[Efficiently Encode Images](https://developers.google.com/web/tools/lighthouse/audits/optimize-images)
[Defer Offscreen Images](https://developers.google.com/web/tools/lighthouse/audits/offscreen-images)
[Properly Size Images](https://developers.google.com/web/tools/lighthouse/audits/oversized-images)
[Serve Images In Next-Gen Formats](https://developers.google.com/web/tools/lighthouse/audits/webp)
[Enable Text Compression](https://developers.google.com/web/tools/lighthouse/audits/text-compression)
[Minify Javascript](https://developers.google.com/web/tools/lighthouse/audits/bootup)
[Minify Css](https://developers.google.com/web/tools/lighthouse/audits/minify-css)
[Defer Unused Css](https://developers.google.com/web/tools/lighthouse/audits/unused-css)
[Preload Key Requests](https://developers.google.com/web/tools/lighthouse/audits/preload)
[Preconnect To Required Origins](https://developers.google.com/web/tools/lighthouse/audits/preload)
[Use Video Formats For Animated Content](https://developers.google.com/web/tools/lighthouse/audits/optimize-images)
Report data
Focus mainly on how long the page takes to load and respond. The lower the number, the better for you.
- The green color indicates that the page load time is less than 1.1 seconds, which is a great result.
- The yellow color indicates the time between 1.1 and 2.5 seconds, which is worse, but still not critical.
- If you see a red color, you should fix the problem as soon as possible, because it means that the load time is more than 2.5 seconds, which indicates a pretty big problem for your site.
If you get lost in the output report, don’t worry. Most of this information is for developers, not marketers. As a marketer, you should make an overall evaluation of the status of page loading speed, and if the results are not very convenient, you should forward a report to the development department.
